
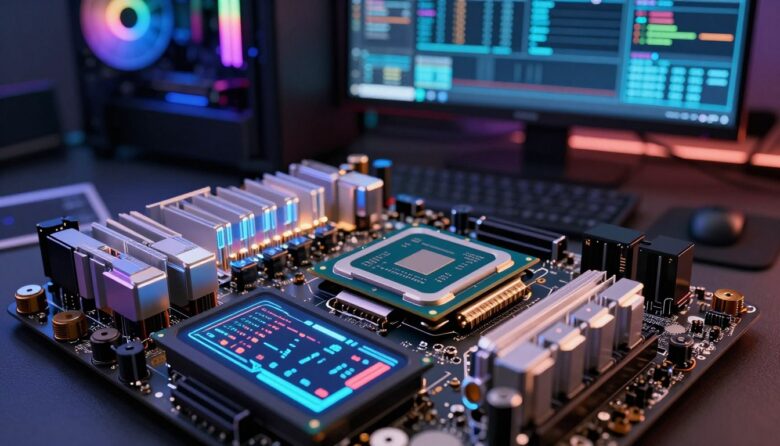
I’ll walk you through a clear, hands-on introduction for evaluating your processor and system health. My goal is simple: show methods that reveal whether your device runs reliably under heavy load and when it needs upgrades.
Using Windows systems and common utilities, I explain how a cpu stress test pushes a processor with many operations over a set period of time. This lets you spot overheating, crashes, or slowdowns before they become major problems.
What stress testing taught me about real system stability
I used to think that if my computer turned on and ran my usual apps, everything was fine. But after running a proper stress test for the first time, I noticed temperatures rising much faster than expected, even though daily use seemed normal. That experience made me realize that problems often only appear under heavy load, not during casual use. Since then, I always run a short test after any upgrade or maintenance, just to be sure everything is working as it should. My honest view is that stress testing isn’t about pushing your system to the limit for no reason—it’s about understanding its behavior and avoiding surprises later. A simple tip that helped me a lot is to monitor temperatures closely and stop immediately if something looks off, instead of letting the test run unattended. This habit has saved me from potential damage and made my setups much more reliable over time.
For example, running a focused cpu stress testing routine may show that your computer needs more RAM or better cooling. I use plain language and step-by-step reasoning so you can interpret results and improve performance without guesswork.
Key Takeaways
- Performing a cpu stress test reveals stability and capacity limits of your processor and system.
- Windows tools make monitoring device temperatures, power draw, and performance straightforward.
- Common signs—overheating or crashes—often point to cooling or RAM upgrades.
- I recommend testing for a set time and recording results for comparison.
- Regular cpu stress testing helps keep your computer reliable during heavy workloads.
Why You Should Stress Test Your CPU
I begin with short, intense checks that expose overheating or instability before small issues become failures. These checks help me see whether a processor and cooling setup handle real demand.
Identifying Overheating Risks
Overheating is a leading cause of system instability. When a processor runs under high load, temperature climbs fast and can throttle speed or cause sudden shutdowns.
A proper cpu stress test verifies that your device can handle power draw and modern software without crashing. I recommend running a short stability test before relying on a computer for critical work or long gaming sessions.
- Run a stability test to catch overheating before hardware damage occurs.
- Monitor temp and power during a cpu stress session to spot cooling shortfalls.
- Use results to plan upgrades that boost performance and long-term reliability.
Keeping processors stable matters for every user who depends on steady speed and uptime.
Essential Safety Precautions Before You Begin
Before any heavy evaluation, I always confirm safe airflow and clear vents around the machine.
Always monitor temperature with reliable tools. I use HWMonitor or CoreTemp on my Windows rigs so I can stop a run if values climb. That prevents hardware damage and helps preserve system stability.
Keep laptop runs short. Many laptops lack desktop cooling. Long sessions can harm fans and ram, and may lead to shutdowns.

“I stop immediately when temps hit the safe limit shown by monitoring software.”
- Make sure the computer has open vents and steady room airflow.
- Close background apps on Windows for accurate results during a cpu stress session.
- Avoid testing in hot rooms; ambient heat raises component temperature quickly.
| Check | Why it matters | My action |
|---|---|---|
| Ventilation | Prevents overheating | Clear desk space, clean filters |
| Temperature monitoring | Protects hardware | Run HWMonitor or CoreTemp |
| Workload duration | Lowers risk on laptops | Limit time and watch fans |
How to Stress Test CPU Using Built-in Windows Tools
A quick check with native Windows utilities reveals how everyday apps load your processor. I use this first because it shows real behavior without pushing the machine to maximum.

Monitoring Real World Performance
Open Task Manager with Ctrl + Shift + Esc and watch the Performance tab. This built-in tool shows cpu usage, threads, and core activity in real time.
Task Manager is best for observing real-world cpu load rather than forcing maximum power.
- Watch active processes and their percent use to see if applications spike the processor.
- Check average cpu load and clock speed while running typical workflows.
- Use this method as an example before moving on to dedicated cpu stress test apps.
“I start with Task Manager to confirm my computer handles daily work, then move to more intense testing if needed.”
| Action | What I look for | Next step |
|---|---|---|
| Open Task Manager | Real-time cpu graphs, processes | Note unusual spikes |
| Observe Performance tab | Average load and clock speed | Compare across tasks |
| Count active processes | Background impact on system | Close unneeded apps |
Advanced Software for Maximum Load Testing
When you need definitive proof of system endurance, advanced utilities reveal issues that casual checks miss. I use these tools after initial checks to push a machine and gather precise data on performance and heat under sustained load.
Using AIDA for Diagnostics
I recommend AIDA64 as the best cpu stress tool for deep hardware diagnostics. AIDA64 provides detailed reports on sensors, voltages, and subsystem stability.
Run its system stability module while monitoring temps and power delivery. The reports help me see weak links in cooling, memory, or power rails.
Pushing Limits with Prime
Prime95 is my go-to when I want maximum load on processors. It forces 100% across cores and often exposes cooling or power problems quickly.
I run Prime95 alongside monitoring apps and watch for errors. Any calculation errors point to instability in the processor, RAM, or power delivery.
Comparing Benchmarking Tools
Both tools have strengths: AIDA64 for diagnostics and Prime95 for raw load. I often run both in separate sessions and compare results for a clearer picture.
- AIDA64 — best for detailed hardware reports and system stability scans.
- Prime95 — best cpu benchmark for maximum load and error detection.
- Use these tools to include graphics card and RAM checks for full system confidence.
“Monitor every run closely; these utilities are designed to push hardware to absolute limits.”
Utilizing Online Tools for Quick Stability Checks
I often reach for browser-based tools when I want a quick check of system responsiveness under load. These tools let me run a compact cpu stress test without installing software.
The CPUX.Net Stress Tool is my go-to for short checks. It can set up to 128 threads and 100% power, so I can simulate a high load across many processors.
Watch the FPS indicator closely. A steady 60 FPS means smooth rendering, while a drop below 30 FPS often signals the system is struggling. That gives a quick read on performance during online testing.
- I make sure the thread count matches reasonable use—don’t pick the maximum unless you want maximum load.
- Run the tool in the background while using other applications to see real-world behavior.
- Record results for comparison: FPS, cpu load, and any performance dips or crashes.
“For a swift check without installs, this online tool is the best cpu stress method for many users.”
| Action | What I watch | Why it matters |
|---|---|---|
| Set threads and power | Thread count, power % | Simulates real high load |
| Monitor FPS | 60 → smooth, <30 → struggle | Shows rendering and responsiveness |
| Keep running in background | Performance while multitasking | Reveals real stability issues |
Interpreting Results and Troubleshooting Shutdowns
Unexpected shutdowns during full-load runs often point at thermal limits or power delivery problems.
Sudden power-offs are frequently a protective feature that shields the processor and other hardware from damage. I watch temperatures first; if values spike quickly, the case or cooler may not be moving enough air.
- Confirm fan curves and airflow are working and clean any dust.
- Verify the power supply can handle the processor and graphics card under high load.
- Look for drops in speed or FPS; those show the device can’t hold stability performance during peaks.
It’s normal for a device to become warm during a cpu stress test, but shutdowns are not normal. If shutdowns repeat, the problem may be poor cooling, an underpowered PSU, or misconfigured settings.
“When a system cuts power mid-run, I treat it as a red flag and stop further testing until cooling and power are checked.”
| Issue observed | Likely cause | Immediate action | Follow-up |
|---|---|---|---|
| Sudden shutdown | Overheating or insufficient power | Stop run and cool system | Clean fans, test PSU capacity |
| Speed/FPS drops | Thermal throttling or GPU limits | Lower load or close apps | Improve cooling, check graphics card |
| Frequent errors | RAM or processor instability | Run memory diagnostics | Reseat RAM, update drivers, check voltages |
Conclusion
, I wrap up with clear steps you can use regularly to keep your system reliable and cool.
I recommend routine checks and simple monitoring. Regular tests help catch thermal or power issues early, so repairs or upgrades stay small and affordable.
Always watch temperatures and run checks with trusted tools. Prioritize safety by stopping any run if values climb or if the machine behaves oddly. Proper testing protects components and extends lifespan.
I hope this guide has given you the confidence to manage performance and fix instability when it appears. Consistent attention is the best way to keep your device running at peak potential for years.
FAQ
What is the purpose of running a full stability and performance check on my processor?
I run these checks to reveal overheating, throttling, or instability under heavy load. That helps me confirm cooling effectiveness, power delivery, and whether my system stays reliable during gaming, content creation, or benchmarking.
When should I perform an overheating and stability assessment?
I perform one after major hardware changes, new thermal paste, BIOS updates, or when I notice crashes, blue screens, or unexpected slowdowns. Regular checks catch issues before they damage components.
What safety steps must I follow before starting a maximum load run?
I ensure good ventilation, set conservative fan curves, update drivers and firmware, and monitor temperatures with a reliable utility. I also save work and close unnecessary apps so the system focuses on the diagnostic run.
Can I use built-in Windows tools for basic load and performance verification?
Yes. I use Task Manager and Resource Monitor to apply sustained multi-thread workload and watch temperatures. These tools give a quick look at core usage, clock speeds, and whether backgrounds interfere with results.
Which advanced utilities do I prefer for max-load diagnostics and component checks?
I use Prime95 for sustained compute load, AIDA64 for combined system diagnostics, and Cinebench for single- and multi-core scoring. These real-world tools stress processors, memory, and sometimes power delivery to reveal weaknesses.
Are there web-based or lightweight online checks for quick stability feedback?
I use browser-based stress pages sparingly for a fast smoke test, but they’re limited. For meaningful results I rely on dedicated apps that reach higher sustained loads and provide temperature logs.
How do I interpret failing runs, thermal shutdowns, or sudden reboots?
I view repeated crashes as signs of overheating, inadequate power, or unstable settings. I reduce clock or voltage, improve cooling, test RAM with MemTest86, and check PSU health until the system is stable under sustained load.
How long should I run a maximum-load diagnostic to feel confident about stability?
I run short verification passes for 30–60 minutes, and longer validation runs for 4–24 hours depending on my risk tolerance. Extended runs expose intermittent issues that brief checks miss.
What temperature thresholds make me stop a heavy workload immediately?
I stop if sustained core temps approach the manufacturer’s TJunction maximum or if throttling becomes severe. For most modern chips I avoid sustained temps above 85–90°C and act sooner for older hardware.
How do I compare results between different benchmarking and load utilities?
I compare scores, clock behavior, and temperature trends rather than raw numbers. Consistent high load, stable clocks, and reasonable temps across Prime95, AIDA64, and Cinebench indicate a healthy setup.
Can I test processor performance while also checking the graphics card and memory?
I run combined workloads in AIDA64 or specific benchmarks that stress both CPU and GPU to observe system-level power, thermal interaction, and memory bandwidth behavior under simultaneous demand.
What common troubleshooting steps fix frequent instability during heavy workloads?
I reseat cooling, reapply high-quality thermal paste, update BIOS, dial back aggressive overclocks, test RAM, and verify PSU capacity. These actions resolve most thermal and stability problems.
How do results affect decisions about upgrades or component replacement?
I use failure patterns and temperature headroom to decide. If cooling or power limits cause constraints, I upgrade the cooler or PSU. If cores underperform despite proper cooling, I consider a newer processor or motherboard.
Which monitoring tools do I use during the entire diagnostic process?
I favor HWInfo and Core Temp for detailed logging, MSI Afterburner for overlay readouts, and Windows Performance Monitor for long-term traces. These give the clarity I need to act on findings.
How do I ensure my procedure and findings remain repeatable and trustworthy?
I document settings, ambient temperature, and steps, then repeat tests at different times. Consistent results across runs confirm true behavior rather than transient anomalies.

Adrian Wolfe is a hardware specialist focused on CPUs, system performance, and computing architecture. He provides detailed insights, benchmarks, and optimization tips to help users get the most out of their processors, whether for gaming, productivity, or high-performance workloads.